
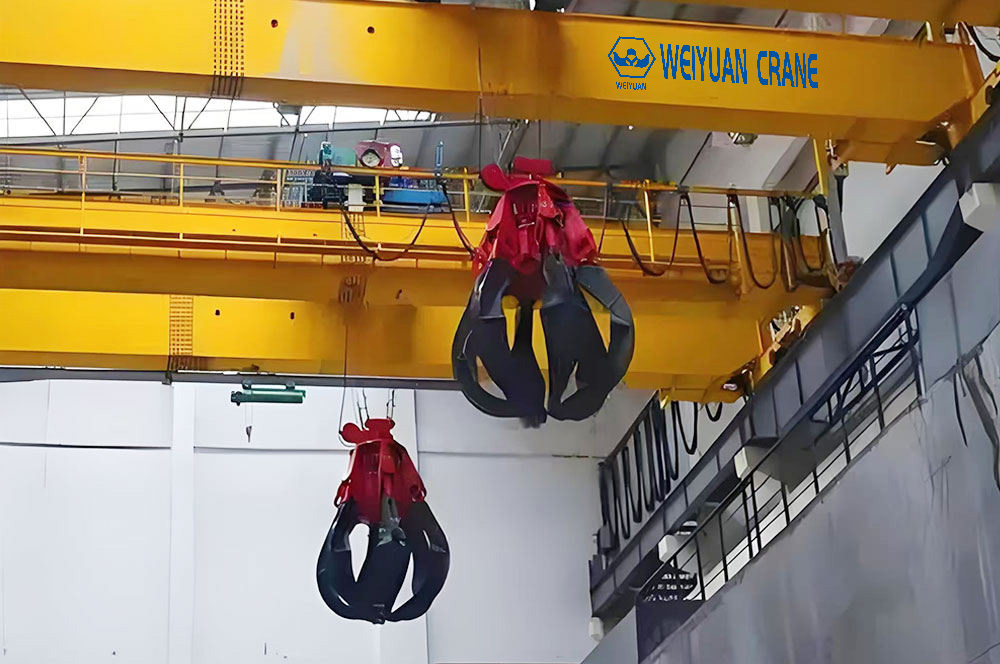
Bridge Crane Runway Alignment Survey: How 4D Measurement Catches Problems Before They Cost You
Introduction
Traditional runway alignment surveys require something most production facilities cannot easily give: a stopped crane.
A surveyor with a total station needs the crane bridge out of the way to measure the runway rails. The measurement happens once a year, if that — scheduled into a maintenance window that competes with every other activity that needs the crane offline. Between surveys, the runway can drift for months without anyone knowing.
A new generation of 4D measurement systems changes this. The “4D” refers to three spatial dimensions plus time — specifically, the ability to compare the runway’s geometry in two conditions: with the crane bridge positioned over the section being measured, and with the bridge elsewhere. This comparison, repeated across the runway’s length and repeated over time, reveals not just where the runway sits today, but how it is moving — without taking the crane out of service to find out.
This guide explains why runways drift, why traditional surveys catch problems late, how 4D measurement works, and when the investment in this technology pays for itself.
Part 1: Why Runways Drift Out of Alignment
Foundation Settlement
Every foundation settles slightly under load — the question is whether it settles uniformly. If one column’s foundation settles more than its neighbors, that column drops relative to the runway line, creating a low point in the rail at that location.
Settlement is rarely instantaneous. It progresses gradually over months or years as the soil beneath the foundation consolidates under the sustained load. A runway that was perfectly aligned at installation can develop measurable settlement-induced misalignment within 3 to 5 years — particularly on sites with variable subsurface conditions between column locations.
Column Deflection Under Repeated Loading
Runway support columns flex slightly every time the crane passes, under the lateral and longitudinal forces described in this series’ runway beam design guide. Most of this flex is elastic — the column returns to its original position when the load passes.
But some columns, particularly those with marginal lateral stiffness or connections that loosen slightly over time, accumulate a small permanent set with each loading cycle. Individually negligible, these increments compound over hundreds of thousands of cycles into measurable permanent displacement — shifting the runway’s gauge (the distance between the two rails) at that column’s location.
Connection Wear and Loosening
Rail clips, bracket bolts, and beam-to-column connections experience the same cyclic loading as the rest of the structure. Bolts can lose preload over time — particularly at connections subject to vibration and repeated load reversal. A loosened connection allows small relative movements between the runway beam and its support that would not occur with a fully tight connection.
These small movements accumulate as wear at the bearing surfaces — bolt holes elongate slightly, contact surfaces develop fretting wear — each contributing a small additional degree of freedom that allows the runway’s alignment to drift under operational loading.
Thermal Cycling
For outdoor runways, and for indoor runways in facilities with significant seasonal temperature variation, the runway beams themselves expand and contract with temperature. If the rail attachment system does not accommodate this movement correctly — for example, if a clip has seized due to corrosion and no longer allows the rail to slide — thermal expansion forces can permanently distort the rail alignment over repeated seasonal cycles.
Part 2: The Limits of Traditional Survey Methods
The Crane Must Be Out of the Way
A total station survey measures points on the runway rail or beam using line-of-sight optical measurement. If the crane bridge is positioned over the section being measured, it physically blocks the line of sight to many of the measurement points — particularly points on the top of the rail and the inner face of the beam web.
This means traditional surveys are performed with the crane moved away from the section under measurement — capturing the runway’s geometry in its unloaded condition only.
Unloaded Geometry Is Not the Whole Picture
The runway’s unloaded geometry — its position when no crane is on the section being measured — is useful baseline information. But it does not capture how the runway behaves under the load that actually causes wear: the crane wheel load passing over that section.
A runway section that measures within tolerance when unloaded might deflect or shift measurably when the crane bridge is positioned over it — and that loaded condition is when the wheel-to-rail contact geometry actually matters for wear and tracking behavior. Traditional surveys, by necessity, miss this.
Survey Frequency Is Limited by Downtime Cost
Because traditional surveys require crane downtime, facilities schedule them infrequently — typically annually for high-cycle cranes, sometimes less often for lower-cycle applications. Between surveys, alignment can drift without detection.
A runway that drifts at 1mm per year might exceed a 3mm tolerance within 3 years of the last measurement — but if the next scheduled survey is also a year away, the out-of-tolerance condition could persist undetected for months, during which wheel and rail wear accelerates.
Part 3: How 4D Measurement Works
The Core Innovation: Loaded vs Unloaded Comparison
A 4D measurement system uses a measuring unit — typically mounted on the crane bridge itself, or positioned along the runway centerline — that continuously or periodically captures the runway’s geometry as the crane operates normally.
The system collects two datasets for each runway segment: one dataset captured when the crane bridge is positioned over that segment (the “loaded” condition for that segment), and another captured when the bridge is positioned elsewhere (the “unloaded” condition for that segment).
By comparing these two datasets for the same physical segment, the system separates two distinct effects: the runway’s underlying geometric position (captured in the unloaded dataset), and the additional deflection or movement that occurs specifically when the crane wheel load is present at that location (revealed by the difference between loaded and unloaded datasets).
What Gets Measured
For each runway beam segment, the system measures: the position of the beam web surface at top, middle, and bottom locations relative to the design centerline, the distance from the crane bay centerline to the average position of points between adjacent runway beam joints (capturing the rail’s effective running line), and — by combining data from both runway beams across the bay — the span variation (the distance between the two rails) along the full length of the runway.
Tilt Compensation
The measuring unit includes a dual-axis compensator — essentially a precision inclinometer — that measures the unit’s own tilt relative to true vertical (the direction of gravity). This allows the system to correct the raw measurement data for any tilt in the measuring unit itself, ensuring that the reported runway geometry reflects the runway’s actual position rather than an artifact of how the measuring equipment happens to be oriented at the moment of measurement.
Continuous Operation Without Production Interruption
Because the measurement unit operates while the crane continues its normal duty cycle — using the crane’s own movements to generate the loaded/unloaded comparison data — no dedicated survey downtime is required. The system can accumulate measurement data continuously, or at scheduled intervals, without removing the crane from service.
Part 4: From Measurement to Action
Automated Threshold Comparison
The measurement system compares each measured parameter — gauge, elevation difference, straightness, span variation — against pre-determined thresholds based on CMAA Specification No. 70 tolerances (or tighter project-specific tolerances where required).
When a measured deviation exceeds the threshold, the system generates a report or alarm identifying the specific location and the magnitude of the deviation, allowing maintenance teams to plan a targeted inspection and correction rather than a full runway re-survey.
Trend Analysis — The Real Value
A single measurement establishes a point-in-time condition. A series of measurements over time establishes a trend — and the trend is what allows problems to be addressed before they become urgent.
Consider a runway span that measures 3mm wider than design in January, 3.5mm in April, 4mm in July, and 4.5mm in October — a drift rate of approximately 0.5mm per quarter, or 2mm per year. If the tolerance limit is 6mm (twice the ±3mm CMAA gauge tolerance, since this example tracks total span deviation rather than per-rail gauge), this runway will exceed tolerance in approximately 18 months from the October measurement.
With this trend identified, maintenance can be scheduled proactively — during a planned shutdown, with parts ordered in advance — rather than reactively, after the deviation has already caused wheel flange contact and accelerated wear, or after a connection has developed visible fatigue cracking.
Separating Geometric Drift from Elastic Deflection
The loaded-vs-unloaded comparison also distinguishes between two different problems that might otherwise look similar in a single measurement:
Geometric drift: the runway’s underlying position has permanently shifted — visible in both the loaded and unloaded measurements, indicating settlement, permanent column displacement, or connection wear that has accumulated as permanent set.
Elastic deflection: the runway deflects under load but returns to its baseline position when unloaded — this is normal structural behavior, but if the magnitude of this elastic deflection is increasing over time (even though the unloaded baseline remains stable), it can indicate developing issues such as loosening connections that are increasing the structure’s flexibility under load, even before any permanent geometric shift occurs.
Both types of trend are valuable maintenance indicators, and only a measurement system that captures both loaded and unloaded conditions can distinguish between them.
Part 5: When Correction Is Triggered
CMAA Specification No. 70 Tolerance Reference
Track gauge (distance between rail centerlines): ±3mm from nominal at any measurement point.
Elevation difference between the two rails at any cross-section: ≤10mm.
Individual rail straightness: ±2mm in any 10-metre length.
Rail joint step: ≤0.5mm.
Warning Threshold — 80% of Tolerance
Many facilities implementing 4D monitoring systems set an internal warning threshold at approximately 80% of the CMAA tolerance — for example, ±2.4mm for gauge, rather than waiting until the full ±3mm tolerance is reached.
At the warning threshold: schedule a detailed inspection of the affected location, including visual examination of rail clips, connection bolts, and any visible signs of column movement or foundation settlement at that location. This inspection, combined with the trend data, informs whether correction can be deferred to a planned maintenance window or requires more urgent attention.
Correction Methods
Depending on the cause identified during the detailed inspection:
Rail clip adjustment: where rail clips allow some adjustment range, repositioning the rail within the clip’s adjustment range can correct minor gauge or alignment deviations without structural modification.
Shim adjustment at bracket connections: adding or removing shims at the runway beam-to-bracket connection can correct elevation differences caused by minor settlement or connection wear, restoring the rail to its design elevation.
Realignment and re-anchoring: for larger deviations, the rail may need to be unbolted, repositioned, and re-anchored at the correct location — a more significant maintenance task typically requiring a planned shutdown.
Foundation remediation: if the root cause is ongoing foundation settlement (rather than a one-time shift that has stabilized), foundation underpinning or other geotechnical remediation may be required to address the underlying cause rather than repeatedly correcting the symptom.
Verification After Correction
After any correction, a follow-up measurement confirms the runway is back within tolerance — and establishes a new baseline for ongoing trend monitoring.
Part 6: When the Investment Makes Sense
High-Value Continuous Production
Facilities running multi-shift continuous production, where the crane cannot be taken out of service for a traditional survey without disrupting production, are the clearest beneficiaries of continuous 4D monitoring. The system collects alignment data during normal operation — no scheduled downtime required for measurement itself.
Cost Comparison
Traditional survey cost (annual, requiring crane downtime): survey labor cost ($1,500 to $4,000 per survey) plus the production cost of the downtime required to perform it (highly variable, but for facilities where crane downtime costs $1,000+ per hour, even a half-day survey represents a meaningful cost).
4D monitoring system cost: equipment investment ($15,000 to $40,000 depending on system scope and runway length) plus minimal ongoing labor for data review.
Avoided cost from early detection: a single avoided incident — a runway misalignment that progresses to wheel flange contact, accelerated wheel wear, and eventually a fatigue crack at an end truck connection — typically costs $15,000 to $40,000 in wheel set replacement, rail correction, and the associated downtime. Catching the trend early enough to correct with a shim adjustment, rather than a full wheel set and rail replacement, is the primary source of return on the monitoring investment.
When Traditional Surveys Remain Adequate
For lower-cycle cranes (CMAA Class A-B), facilities where scheduled annual downtime is readily available without production impact, or shorter runways where a traditional survey can be completed quickly during routine maintenance — the continuous monitoring investment may not be justified. Annual traditional surveys, performed consistently and compared against previous results to identify trends manually, remain an adequate alignment monitoring approach for these applications.
Frequently Asked Questions
Q: Does a 4D measurement system require permanent installation on the crane, or can it be used as a periodic survey tool?
A: Both configurations exist. Permanently mounted systems on the crane bridge provide continuous data collection during normal operation — the most comprehensive approach for high-value continuous production. Portable systems, positioned temporarily along the runway centerline or temporarily mounted on the crane for a measurement campaign, can perform a 4D survey (capturing loaded and unloaded data as the crane is operated through its normal range during the survey period) without requiring permanent installation — providing the loaded/unloaded comparison advantage of 4D measurement on a periodic survey basis, at lower cost than permanent installation, though without continuous trend data between survey campaigns.
Q: Can 4D measurement detect problems that traditional surveys would miss entirely?
A: Yes — specifically, issues that only manifest under load. A connection that has lost some preload, for example, might show no detectable displacement when the runway is measured unloaded (the connection’s remaining preload is sufficient to hold the structure in its nominal position with no load applied) but might allow measurable additional deflection when the crane wheel load passes over that location. Traditional unloaded-only surveys cannot detect this — the structure measures correctly when unloaded. A 4D system, by capturing the loaded condition specifically, can detect this developing condition before it progresses to a point where it is also visible in the unloaded geometry.
Q: How often should 4D monitoring data be reviewed?
A: For systems providing continuous data collection, monthly review of trend data is a reasonable starting point for most production facilities — frequent enough to catch developing trends well before they approach tolerance limits, but not so frequent that normal measurement noise is mistaken for a trend. For facilities with particularly aggressive duty cycles or known historical alignment issues, more frequent review (weekly) during the period immediately following any correction can help confirm the correction is holding before reverting to monthly review.